Beyond GDP Examples
The following examples describe efforts by the United Nations, various international organisations and research groups, to replace the dominant measure of economic progress, Gross Domestic Product (GDP), which considers only the flow of money through the economy, by other accounting measures or indicators that more directly measure human and environmental well-being. A number of countries have also created their own alternative national accounting in the same direction. These examples can serve as inspiration for our own efforts to develop Global Solidarity Accounting and Community Conversations about well-being, public discourse about our future, and social action to address problems identified.
UNITED NATIONS
Our Common Agenda
Fourth, now is the time to correct a glaring blind spot in how we measure economic prosperity and progress. When profits come at the expense of people and our planet, we are left with an incomplete picture of the true cost of economic growth. As currently measured, gross domestic product (GDP) fails to capture the human and environmental destruction of some business activities. I call for new measures to complement GDP, so that people can gain a full understanding of the impacts of business activities and how we can and must do better to support people and our planet.
(UN Secretary-General, 2021, Our Common Agenda, Summary, https://www.un.org/en/content/common-agenda-report/summary.shtml)
UN System of Environmental Economic Accounting (SEEA)
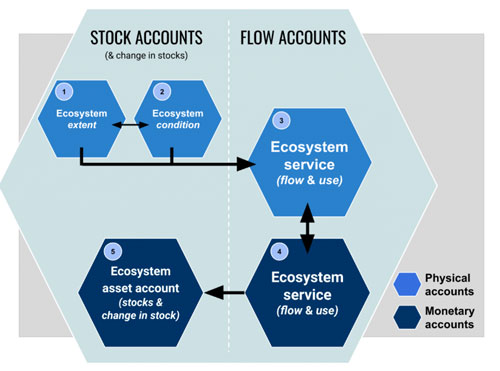
The SEEA Ecosystem Accounting (SEEA EA) constitutes an integrated and comprehensive statistical framework for organizing data about habitats and landscapes, measuring the ecosystem services, tracking changes in ecosystem assets, and linking this information to economic and other human activity.
The United Nations Statistical Commission adopted the SEEA Ecosystem Accounting at its 52nd session in March 2021.
The SEEA EA is built on five core accounts. These accounts are compiled using spatially explicit data and information about the functions of ecosystem assets and the ecosystem services they produce.
The five ecosystem accounts are:
1. ECOSYSTEM EXTENT accounts record the total area of each ecosystem, classified by type within a specified area (ecosystem accounting area). Ecosystem extent accounts are measured over time in ecosystem accounting areas (e.g., nation, province, river basin, protected area, etc.) by ecosystem type, thus illustrating the changes in extent from one ecosystem type to another over the accounting period.
2. ECOSYSTEM CONDITION accounts record the condition of ecosystem assets in terms of selected characteristics at specific points in time. Over time, they record the changes to their condition and provide valuable information on the health of ecosystems.
3. & 4. ECOSYSTEM SERVICES flow accounts (physical and monetary) record the supply of ecosystem services by ecosystem assets and the use of those services by economic units, including households.
5. MONETARY ECOSYSTEM ASSET accounts record information on stocks and changes in stocks (additions and reductions) of ecosystem assets. This includes accounting for ecosystem degradation and enhancement.
The SEEA EA also supports ‘thematic accounting’, which organizes data around specific policy-relevant environmental themes, such as biodiversity, climate change, oceans and urban areas. Other important thematic accounts would include accounting for protected areas, wetlands and forests.
A key aspect of ecosystem accounting is that it allows the contributions of ecosystems to society to be expressed in monetary terms so those contributions to society’s well-being can be more easily compared to other goods and services we are more familiar with. Monetary estimates can provide information for decision-makers, for example for economic policy planning, cost-benefit analysis, and for raising awareness of the relative importance of nature to society.
The SEEA EA takes a spatial approach to accounting, as the benefits a society receives from ecosystems depend on where those assets are in the landscape in relation to the beneficiaries. In contrast, the SEEA Central Framework looks at individual environmental assets (resources), such as water or energy resources.
As a result, ecosystem accounts are commonly presented using maps, bringing together geographical, environmental, ecological, and economic information in one place, as well as tables.
The SEEA EA can be compiled at different spatial scales, including the subnational (state, river basin, protected area, urban, etc.), or national level and across terrestrial, freshwater and marine areas.
SOURCE: https://seea.un.org/ecosystem-accounting
Mulltidimensional Poverty Index
(UNDP Human Development Report, revised by Sustainable Development Solutions Network SDSN)
Multidimensional poverty assessments aim to measure the non-income based dimensions of poverty, to provide a more comprehensive assessment of the extent of poverty and deprivation.
The Multidimensional Poverty Index (MPI) is published by the UNDP’s Human Development Report Office and tracks deprivation across three dimensions and 10 indicators: health (child mortality, nutrition), education (years of schooling, enrollment), and living standards (water, sanitation, electricity, cooking fuel, floor, assets).
It first identifies which of these 10 deprivations each household experiences, then identifies households as poor if they suffer deprivations across one -third or more of the weighted indicators.
At a minimum this “MPI2015” would track extreme deprivation in nutrition, health, education, water, sanitation, clean cooking fuel, and reliable electricity, to show continuity with MDG priorities. More specifically it would reflect the following deprivations:
1. Adult or child malnourishment
2. Disrupted or curtailed schooling (a minimum of years 1-8)
3. The absence of any household member who has completed 6 years of schooling
4. Child mortality within the household within the last 5 years
5. Lack of access to safe drinking water
6. Lack of access to basic sanitation services
7. Lack of access to clean cooking fuel
8. Lack of basic modern assets (radio, TV, telephone, computer, bike, motorbike, etc.)
9. Lack of access to reliable electricity
Potential additional indicators to reflect the SDGs include work; housing; violence; social protection; quality of schooling; health system functioning; teenage marriage or pregnancy; solid waste disposal; birth registration; internet access; farm assets and a household’s vulnerability to economic shocks and those posed by natural hazards and/or quality of work; and empowerment or psychological wellbeing.
https://indicators.report/indicators/i-3/
INTERGOVERNMENTAL ORGANIZATIONS
Wellbeing Economic Alliance
The Wellbeing Economy Alliance (WEAll) is the leading collaboration of changemakers working together to transform the economic system.
WEAll’s vision is that economies around the world are redesigned to create shared wellbeing for people and planet by 2040.
WEAll aims to build a world where everyone has enough to live in comfort, safety, and happiness. Where all people feel secure in their basic comforts and can use their creative energies to support the flourishing of all life on this plant. Where we thrive in a restored, safe, and vibrant natural environment because we have learned to give back as much as we are given. A world where we have a voice over our collective destiny and find belonging, meaning and purpose through genuine connection to the people and planet that sustain us.
The wellbeing economy framework “serves people and the planet, rather than people and planet serving the economy. It does more than ‘move money around’ but delivers good live to people.” WeAll describes the core needs for human beings as:
- Dignity: Everyone has enough to live in comfort, health, safety, and happiness.
- Nature: A restored and safe natural world for all life.
- Connection: A sense of belonging and institutions that serve the common good.
- Fairness: Justice in all its dimensions is at the heart of economic systems, and the gap between the richest and poorest is greatly reduced.
- Participation: Citizens are actively engaged in their communities and locally rooted economies.
The Wellbeing Economy Governments partnership (WEGo) is a collaboration of national and regional governments promoting sharing of expertise and transferrable policy practices. The aims are to deepen their understanding and advance their shared ambition of building wellbeing economies. WEGo, which currently comprises Scotland, New Zealand, Iceland, Wales and Finland, is founded on the recognition that ‘development’ in the 21st century entails delivering human and ecological wellbeing.
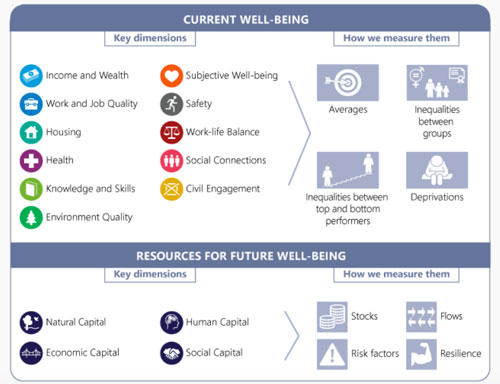
Measuring Wellbeing
Purpose: Measure and assess wellbeing over time, in order to support effective policy development. As you move beyond GDP as the major indicator of progress, you will want to develop new wellbeing measurements. Developing wellbeing indicators can help you to better understand the current level of wellbeing and track its performance over time. As the determinants of wellbeing are multi-dimensional, these measurements can help policymakers to better understand synergies and trade-offs between dimensions over time. Measuring wellbeing requires looking at how society as a whole is progressing across all of your various wellbeing dimensions, rather than using economic indicators as a proxy for wellbeing or focusing on specific areas at the expense of others. (Wellbeing Economy Policy Design Guide, p. 18)
WEAll Tips:
• Employ qualitative and quantitative methods to find appropriate indicators for the wellbeing priorities, noting that often, wellbeing priorities will be multi-dimensional or subjective.
• Support local data generation and community engagement in the selection of indicators, making clear that community members will be involved in the monitoring and evaluation of policies.
• Identify intuitive indicators that can be easily understood by a general audience.
• Prioritise indicators that directly connect with desired outcomes, rather than an input/driver. For example, measure whether people feel safe in their neighbourhood (an outcome), rather than number of police officers (an input).
• Find indicators that directly correspond to a dimension in your Wellbeing Framework and that have a positive relationship with other dimensions as well.
• Explore existing wellbeing metrics and indicators for inspiration (see table), but ensure adaptation to your communities’ unique values and priorities.
• Identify internationally comparable indicators, where possible, to benchmark performance against other countries and communities over time.
Examples of Wellbeing Measurements (some of these are described below)
• Sustainable Development Goals (SDG) Indicators https://unstats.un.org/sdgs/indicators/Global%20Indicator%20Framework%2…
• Social progress Index https://www.socialprogress.org/index/global/methodology
• Genuine progress index https://www.economicshelp.org/blog/2666/economics/genuine-progress-indi…
• OECD wellbeing framework https://www.oecd.org/wise/measuring-well-being-and-progress.htm
• Happy planet Index https://happyplanetindex.org/
• Eurostat- Quality of Life indicators https://ec.europa.eu/eurostat/statistics-explained/index.php?title=Qual…
• Wheel of Wellbeing https://wheelofwellbeing.com/quiz/
• Sustainable Wellbeing Index https://www.researchgate.net/publication/305805534_Modelling_and_measur…
• Multidimensional Poverty Index (UNDP HDR/SDSN) https://indicators.report/indicators/i-3/
• Wales National Wellbeing Indicators https://www.gov.wales/sites/default/files/publications/2019-06/national…
• Thriving Places Index https://www.centreforthrivingplaces.org/resources-and-reports/
• New Zealand Wellbeing Indicators https://www.stats.govt.nz/indicators-and-snapshots/indicators-aotearoa-…
• Gallup Wellbeing Index (US only, not relevant)
• Humankind Index (OXFAM Scotland) https://oxfamilibrary.openrepository.com/bitstream/handle/10546/293743/…
• Iceland wellbeing indicators https://www.government.is/lisalib/getfile.aspx?itemid=fc981010-da09-11e…
• Genuine Wealth Accounting (not relevant)
SOURCE: https://wellbeingeconomy.org/wp-content/uploads/Wellbeing-Economy-Polic…
OECD Well-being Framework
SOURCE: https://www.oecd.org/wise/measuring-well-being-and-progress.htm
EuroStat Quality of Life Indicators
Measuring quality of life
1. Material living conditions
2. Leisure
3. Social interactions
4. Economic security and physical safety
5. Governance and basic rights
6. Natural and living environment
7. Overall experience of life
SOURCE: https://ec.europa.eu/eurostat/statistics-explained/index.php?title=Qual…
NON-GOVERNMENTAL ORGANIZATIONS
Sustainable Wellbeing Index
The UN Sustainable Development Goals (SDGs) offer a detailed dashboard of goals, targets and indicators. In this paper we investigate alternative methods to relate the SDGs to overall measures of sustainable wellbeing that can motivate and guide the process of global societal change. We describe what a Sustainable Wellbeing Index (SWI) that connects with and complements the SDG dashboard might look like. We first investigate several options for how to construct such an index and then discuss what is needed to build consensus around it. Finally, we propose linking the SDGs and our SWI with a comprehensive systems dynamics model that can track stocks and flows and make projections into the future under different policy scenarios.
Costanza et al 2016 DOI: 10.1016/j.ecolecon.2016.07.009 https://www.researchgate.net/publication/305805534_Modelling_and_measur…
Social Progress Index
Our aim is to measure social progress directly, rather than utilize economic proxies and the Social Progress Index is the first measurement to do this. By excluding economic indicators, we can rigorously and systematically analyze the relationship between economic development (measured for example by GDP per capita) and social development. Prior efforts to move “beyond GDP” have commingled social and economic indicators, making it difficult to disentangle cause and effect.
Our aim is to measure the outcomes that matter to the lives of real people, not the inputs. For example, we want to measure a country’s health and wellness achieved, not how much effort is expended nor how much the country spends on healthcare.
https://www.socialprogress.org/index/global/methodology
Genuine Progress Indicator
The Genuine Progress Indicator (GPI) is an attempt to measure the real increase in economic welfare.
The GPI measures the improvement in economic welfare – costs associated with growth. It is measured using the formula
GPI = A + B – C – D + I
• A is income weighted private consumption
• B is value of non-market services generating welfare
• C is private defensive cost of natural deterioration
• D is cost of deterioration of nature and natural resources
• I is an increase in capital stock and balance of international trade
The GPI takes a wider measure of economic indicators into consideration. For example, GPI includes
• value of voluntary work and unpaid work
• value of leisure time
• Distribution of income
• Impact on the environment
• Environmental standards
• Cost of crime
https://www.economicshelp.org/blog/2666/economics/genuine-progress-indi…
Earth for All
(Club of Rome 2022)
“…not until you... account for human wellbeing through the fair distribution of assets and opportunities, and the maintenance of social capital, do you arrive at a truly healthy economy.
In a healthy economy, what many refer to as a wellbeing economy, future prosperity relies not as much on the annual ups and downs of economic activities, which is what GDP per year measures, but on how well those activities build and maintain the commons – in other words, all of its broad capital stocks – over time. The change in a nation’s wealth can be measured as the annual change of all the capitals in a balanced way over time.
In this approach to running an economy, emphasis is placed on balanced growth in the broad wealth that serves all people, no longer in just growing incomes and the wealth of the top wealth holders.”
(p. 158 in S. Dixson-Declève et al. 2022. Earth for All: A survival guide for Humanity. A report to the Club of Rome. Canada: New Society Publishers)
Earth4All Average Wellbeing Index
The goal is... to move beyond GDP to use wellbeing as the central guide to societal progress. A viable indicator must include the interdependence of human wellbeing and a healthy planet. Human needs are universal, but how they are satisfied depends on cultural circumstances. The index builds on the WeAll principles, and quantifies wellbeing through these select variables in the model, calculated annually for ten regions in the model:
- Dignity: worker disposable income (after tax)
- Nature: climate change (global surface average temperature, in Celsius)
- Connection: government services indicated by spending per person, i.e., to institutions that serve the common good
- Fairness: the ratio of owner income after tax to worker income after tax
- Participation: people’s observed progress (previously improving wellbeing) and labor participation
(pp. 51-52 in S. Dixson-Declève et al. 2022. Earth for All: A survival guide for Humanity. A report to the Club of Rome. Canada: New Society Publishers)
Wheel of Wellbeing
The Wheel Quiz is a self assessment that allows you to visualize how balanced your life is. We’ve divided the wheel into 8 spokes, each representing a facet of your life: Physical, Mental, Emotional, Relational, Recreational, Environmental, Spiritual, Financial.
https://wheelofwellbeing.com/quiz/
Thriving Places Index
The Thriving Places Index (TPI) helps put the wellbeing of people, place and planet at the heart of local decision making.
We believe it’s both urgent and possible to shift society’s compass from growth-at-any-cost to a new model of prosperity centred on wellbeing. But to get there we need new ways of thinking and new measures to build a credible base on which to deliver change. The TPI provides just that. It’s systems-change made practical
The Thriving Places Index framework
EQUALITY
Health
Income
Gender
Social
- Ethnicity
LOCAL CONDITIONS
Place and environment
- Local environment
- Housing
- Transport
- Safety
Mental and physical health
- Healthy and risky behaviours
- Overall health status
- Mortality and life expectancy
- Mental health
Education and learning
- Adult education
- Children’s education
Work and local economy
- Unemployment
- Employment
- Basic needs
- Local business
People and community
- Participation
- Culture
- Community cohesion
SUSTAINABILITY
Energy use
Waste
Green infrastructure
SOURCE: https://www.centreforthrivingplaces.org/resources-and-reports/
NATIONAL EXAMPLES OF WELL-BEING INDICATORS
New Zealand Wellbeing Indicators
Current wellbeing
Air quality
Illness attributable to air quality
Cities and settlements
Access to natural spaces; commuting time to work; homelessness; housing affordability; housing quality; overcrowding; resilience of infrastructure
Climate
Costs of extreme weather events
Culture
Engagement in cultural activities; intergenerational transfer of knowledge; te reo Māori speakers
Economic standard of living
Child poverty; income; income adequacy; income inequality; low income; material wellbeing; net worth; value of unpaid work
Ecosystems
Biodiversity/native species
Governance
Corruption; democratic participation; institutional trust; justice equityv Health
Health equity; health expectancy; mental health status (psychological distress); amendable mortality; self-reported health status; spiritual health; suicide
Identity
Language development and retention; sense of belonging
Knowledge and skills
Core competencies (non-cognitive skills); early childhood education (ECE) participation; educational attainment; inequality of educational outcomes; literacy, numeracy, and science skills of 15-year-olds
Land
Active stewardship of land
Leisure
Leisure and personal time; satisfaction with leisure time
Safety
Domestic violence; experience of discrimination; harm against children; injury prevalence; perceptions of safety/feelings of safety; victimisation
Social connections
Contact with family and friends; loneliness; social support
Subjective wellbeing
Ability to be yourself; experienced wellbeing; hope for the future; life satisfaction; locus of control; sense of purpose, whānau wellbeing
Waste
Material intensity (including recycling, landfill inflows, and second-hand economy); waste flows in waterways and coastal marine environments
Water and sanitation
Access to safe water for recreation and food gathering; drinking water quality
Work
Employment rate; hourly earnings; job satisfaction; job strain; not in employment, education, or training (NEET); underutilisation; unemployment; work/life balance; workplace accidents
Future wellbeing
Financial and physical capital
Heritage assets; infrastructure; modified land; net fixed assets; net international investment position; productivity
Human capital
Health expectancy; literacy, numeracy and science skills of 15-year-olds; te reo Māori speakers
Natural capital
Cultural ecosystem services; ecological integrity; efficiency of land use; energy consumption; energy intensity; energy resources; fish stocks; global CO2 concentrations; gross greenhouse gas emissions; land assets; levels of pollutants; mineral resources; net greenhouse gas emissions; ocean acidification; productive land; provisioning ecosystem services; quality of water resources; regulating ecosystem services; renewable energy; soil health; stock of freshwater resources; waste generation; water stress
Social capital
Generalised trust; institutional trust; volunteering
Impact on rest of the world (transboundary impact)
Climate
Consumption of net greenhouse gas emissions
Economic standard of living
Official development assistance; remittances to other countries
Financial and physical capital
Foreign direct investment; international investment position
Human capital
Net migration by skill type
Natural capital
Net greenhouse gas emissions
Waste
Export of waste (net and gross)
Contextual indicators
Population
Age and sex structure, disability status, ethnic composition, family composition, fertility, geographic distribution, household composition, migration, overseas-born population, population size and growth, sexual identity, sexual orientation, urban/rural distribution
Production
Components of final use, national income, production by industry, regional production, returns for factors of production, total New Zealand production
SOURCE: https://www.stats.govt.nz/indicators-and-snapshots/indicators-aotearoa-…
New Zealand – Embracing Indigenous Perspectives of Wellbeing
In 2017, there was a change of government in New Zealand. At the State Opening of Parliament after the election, the Speech from the Throne announced a new vision for the country’s economic policy: “We need to move beyond narrow measures and views of value and broaden the definition of progress. The economic strategy will focus on how we improve the wellbeing and living standards of all New Zealanders.”
As the government of New Zealand worked to develop the world’s first Wellbeing Budget, they began by using the OECD Wellbeing Framework to understand relevant dimensions for wellbeing.
However, the government recognised that much of our contemporary understanding of economic progress and wellbeing, including the OECD’s framework, has been informed by Anglo-Saxon philosophical traditions
Therefore, the government also worked to ensure that diverse communities were able to contribute their voices to defining wellbeing in New Zealand, based on their cultural perspectives, values and knowledge systems
This involved an initiative to develop a vision of wellbeing, based in mātauranga Māori, the knowledge of the country’s Indigenous population. The name for this Wellbeing Framework is He Ara Waiora, meaning “pathway to wellbeing”.
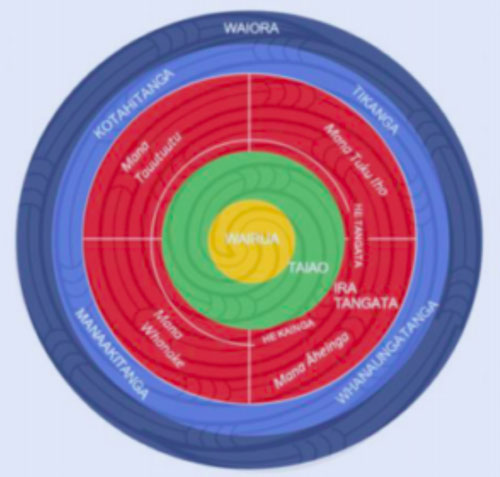
The framework demonstrates relationships between different elements of wellbeing. At the centre is Wairua (spirit), which reflects the values, beliefs and practices that are the foundation or source of wellbeing. Surrounding the spirit (in green) is Taiao (the natural world/environment), which is presented as the foundation and source of social wellbeing.
The next circle, in red, is Ira Tangata (society), which encapsulates human activities and relationships. The concept of mana (power) is seen as vital for wellbeing, with people thriving when they are empowered to grow and develop, connect with others and have the resources they need to flourish.
The outside circles (blue) present principles to guide how people should work together to achieve wellbeing. These emphasise the importance of coordination and alignment, working in partnership and according to the right processes, promoting collective and strength-based actions, protecting and promoting empowerment, and stewardship of the environment.
SOURCE: https://weall.org/resource/new-zealand-embracing-indigenous-perspective…
for further information: https://ir.canterbury.ac.nz/handle/10092/17576
Wellbeing in Vanuatu
One of the most enlightened countries in the world, Vanuatu in the South Pacific, has published a new report Well-being In Vanuatu, a significant government attempt to redefine well-being, particularly in a Melanesian context. The report is the work of several years of planning, fieldwork, data processing and analysis by the Vanuatu National Statistics Office (VNSO) following the 2016 Mini Census. It attempts to look at well-being more holistically, framing it around topics of happiness, access, knowledge, health, and social resilience. This important initiative of Vanuatu establishes and mainstreams indicators of well-being that incorporate Melanesian values into the policy arena.
SOURCE: IEF report https://iefworld.org/node/1160
KEY INDICATORS
SOCIETY 1: A Nation based on traditional governance and Christian principles, which underpin our culture and continue to bestow life skills and knowledge to future generations
SOC 1.1.1 Proportion of population speaking indigenous language daily
SOC 1.1.2 Proportion of population first language learned indigenous
SOC 1.2.1 Proportion of population with knowledge of traditional stories, dances, songs, and games
SOC 1.2.2 Proportion of population possessing common and basic traditional production skills related to weaving, transport, housing, farming, food preparation
SOC 1.2.3 Proportion of population with ability to 1) produce herbal medicines, and 2) massage
SOC 1.7.1 Proportion of population with free access to traditional lands, forest and marine resources
SOC 1.7.2 Proportion of population that use traditional lands for agriculture, marine, forestry and livestock for consumption or customary purposes
SOCIETY 2: An inclusive and equitable quality education system with life-long learning for all
SOC 2.1.1 (p) Percentage of age 6 in Yr. 1 who attended kindergarten
SOC 2.1.2 (p) Survival rates Yrs. 1–6, 1–13
SOCIETY 3: A healthy population that enjoys a high quality of physical, mental, spiritual and social well-being
SOC 3.3.1 Diphtheria tetanus toxoid and pertussis (DTP3) immunization coverage among 1 year old (%)
SOCIETY 4: An inclusive society which upholds human dignity and where the rights of all Ni-Vanuatu including women, youth, vulnerable groups and the elderly are supported, protected and promoted in our legislation and institutions
SOC 4.2.1 Subjective Well-being
SOC 4.3.1 Proportion of population reporting some degree of disability
SOC 4.6.2 (p) Proportion of youth age 13–30 that feel valued in society
SOC 4.7.1 Proportion of youth actively participating in at least one organized sport in the last 12 months by gender
SOCIETY 5: A society where the rule of law is consistently upheld, and access to timely justice is available to everyone
SOC 5.1.3 Average cost of legal fees/services for a court case
SOC 5.5.2 (p) Incidents of theft and vandalism reported annually to the police (and the proportion of reported incidents to unreported)
SOC 5.5.3 Proportion of population with positive assessment of their chief’s ability to resolve disputes peacefully
SOCIETY 6: A dynamic public sector with good governance principles and strong institutions delivering the support and services expected by all citizens of Vanuatu
SOC 6.3.1 Proportion of eligible population reporting to have voted in last election
SOC 6.3.2 (p) Proportion of population with an overall positive assessment of their local elected officials
SOC 6.7.1 Proportion of population utilizing media outlets for news including: newspapers, mobile phones, radio, television, and internet
ENVIRONMENT 1: A nation that ensures our food and nutrition security needs are adequately met for all people through increasing sustainable food production systems and improving household production
ENV 1.1.1 Proportion of households engaged in production of food for own consumption
ENV 1.1.2 Up to date data on primary production (agriculture, livestock, forestry, fisheries, biosecurity) available for analysis and informed decision making and reporting
ENV 1.1.3 Average incidence of food poverty at the household level (Food Poverty Line)
ENVIRONMENT 2: An economy which fosters sustainable growth and development through low impact industries and modern technologies to ensure the wellbeing of future generations
ENV 2.3.2 Proportion of households using renewable energy technology as main source of lighting
ENVIRONMENT 3: A strong and resilient nation in the face of climate change and disaster risks posed by natural and man-made hazards
ENV 3.2.2 Proportion of population with access to technologies that convey early warnings
ENVIRONMENT 5: A nation committed to ensuring the conservation and sustainable management of our biodiversity and ecosystems
ENV 5.3.1 Proportion of population with knowledge of the names of local flora and fauna
ECONOMY 2: Sustainable and well-maintained infrastructure and services for all, through inclusive and effective partnerships
ECO 2.1.1 Proportion of households sourcing energy for lighting from renewable sources
ECO 2.1.2 Total number of mini-grid renewable energy systems in rural communities by province
ECO 2.2.1 Proportion of population with reliable access to safe drinking water
ECO 2.2.2 Proportion of population with reliable access to improved sanitation facilities
ECO 2.6.1 Proportion of population with access to transport by road, sea and air
ECO 2.9.1 Proportion of population having access to broadband connection
ECONOMY 3: A strong rural economy that creates opportunities, enables the development of rural communities and increasingly contributes to national prosperity
ECO 3.2.1 Average annual household income from tourism
ECO 3.6.1 Average traveling distance to nearest school, health facility, and police post by province
ECONOMY 4: An enabling business environment, creating opportunities and employment for entrepreneurs throughout Vanuatu
ECO 4.2.1 Proportion of rural households engaged in trade with family in urban centers
ECO 4.6.1 Labor force participation by sector
Summary Table of Key UN SDG Indicators
GOAL 1. End poverty in all its forms everywhere
1.1.1 Proportion of the population living below the international poverty line by sex, age, employment
1.2.1 Proportion of population living below the national poverty line, by sex and age
1.4.2 Proportion of total adult population with secure tenure rights to land, (a) with legally recognized documentation, and (b) who perceive their rights to land as secure, by sex and type of tenure
GOAL 2. End hunger, achieve food security and improved nutrition and promote sustainable agriculture
2.1.1 Prevalence of undernourishment
2.1.2 Prevalence of moderate or severe food insecurity in the population, based on the Food Insecurity
2.3.2 Average income of small-scale food producers, by sex and indigenous status
GOAL 3. Ensure healthy lives and promote well-being for all at all ages
3.a.1 Age-standardized prevalence of current tobacco use among persons aged 15 years and older
3.5.2 (p) Alcohol per capita consumption (aged 15 years and older) within a calendar year in liters of pure alcohol
3.8.2 Proportion of population with large household expenditures on health as a share of total household expenditure or income
GOAL 4. Ensure inclusive and equitable quality education and promote lifelong learning opportunities for all
4.3.1 Participation rate of youth and adults in formal and non-formal education and training in the previous 12 months, by sex
4.6.1 Proportion of population in a given age group achieving at least a fixed level of proficiency in functional (a) literacy and (b) numeracy skills, by sex
GOAL 5. Achieve gender equality and empower all women and girls
5.b.1 Proportion of individuals who own a mobile telephone, by sex
GOAL 8. Promote sustained, inclusive and sustainable economic growth, full and productive employment and decent work for all
8.5.2 Unemployment rate, by sex, age and persons with disabilities
GOAL 9. Build resilient infrastructure, promote inclusive and sustainable industrialization and foster innovation
9.2.2 Manufacturing employment as a proportion of total employment
GOAL 10. Reduce inequality within and among countries
10.1.1 Growth rates of household expenditure or income per capita among the bottom 40 per cent of the population and the total population
10.2.1 Proportion of people living below 50 per cent of median income, by sex, age and persons with disabilities
GOAL 11. Make cities and human settlements inclusive, safe, resilient and sustainable
11.2.1 Proportion of population that has convenient access to public transport, by sex, age and persons with disabilities
GOAL 16. Promote peaceful and inclusive societies for sustainable development, provide access to justice for all and build effective, accountable and inclusive institutions at all level
16.b.1 Proportion of population reporting having personally felt discriminated against or harassed in the previous 12 months on the basis of a ground of discrimination prohibited under international human rights law
16.1.4 Proportion of population that feel safe walking alone around the area they live
16.5.1 Proportion of persons who had at least one contact with a public official and who paid a bribe to a public official, or were asked for a bribe by those public officials, during the previous 12 months
16.6.2 Proportion of population satisfied with their last experience of public services
16.7.2 Proportion of population who believe decision-making is inclusive and responsive, by sex, age, disability and population group
GOAL 17. Strengthen the means of implementation and revitalize the Global Partnership for Sustainable Development
17.8.1 Proportion of individuals using the Internet
SOURCE:Vanuatu National Statistics Office, Wellbeing in Vanuatu, 2021, pp. 22-31. https://vnso.gov.vu/images/Pictures/NSDP_Baseline/Analysis/Wellbeing_Re…
Iceland Well-being Indicators
(proposal 2019)
SOCIETY
Health
• Life expectancy
• Healthy life years
• Unmet need for healthcare
• Mental health
Education
• Level of education
• Dropout from secondary school
• Lifelong learning
Social capital
• Voter turnout
• Social support
• Formal volunteer activities
• Trust in others
• Trust in political system
Security
• Feeling safe after dark
• Crime victimization
Work-life balance
• Long working hours
• Working during unsocial hours
• Multiple jobs
ENVIRONMENT
Air Quality and Climate
• Particulate matter
• Greenhouse gas emissions
Land Use
• Progress in land reclamation
• Protected areas
Energy
• Ratio of renewable energy in total energy consumption
Waste and Recycling
• Quantity of municipal solid waste
• Recycling rate of municipal solid waste
ECONOMY
Economic conditions
• GDP and economic growth
• Inflation
• Purchasing power
• Household debt
• Public sector, private sector and household dept
Employment
• Employment rate
• Unemployment
• Not in education, employment or training (NEET)
• Job satisfaction
Housing
• Housing cost overburden
• Quality of housing
Incomes
• At risk of poverty
• Persistent poverty
• Material and social deprivation
• Equality (Gini-index)
SOURCE:https://www.government.is/lisalib/getfile.aspx?itemid=fc981010-da09-11e…
Wales National Wellbeing Indicators
1. Percentage of live single births with a birth weight of under 2,500g.
2. Healthy life expectancy at birth including the gap between the least and most deprived.
3. Percentage of adults who have fewer than two healthy lifestyle behaviours (not smoking, healthy weight, eat five fruit or vegetables a day, not drinking above guidelines and meet the physical activity guidelines).
4. Levels of nitrogen dioxide (NO2) pollution in the air.
5. Percentage of children who have fewer than two healthy lifestyle behaviours (not smoking, eat fruit/vegetables daily, never/rarely drink and meet the physical activity guidelines).
6. Measurement of development of young children.
7. Percentage of pupils who have achieved the “Level 2 threshold” including English or Welsh first language and Mathematics, including the gap between those who are eligible or are not eligible for free school meals. (To be replaced from 2017 by the average capped points score of pupils).
8. Percentage of adults with qualifications at the different levels of the National Qualifications Framework.
9. Gross Value Added (GVA) per hour worked (relative to UK average).
10. Gross Disposable Household Income per head.
11. Percentage of businesses which are innovation-active.
12. Capacity (in MW) of renewable energy equipment installed.
13. Concentration of carbon and organic matter in soil.
14. The Ecological Footprint of Wales.
15. Amount of waste generated that is not recycled, per person.
16. Percentage of people in employment, who are on permanent contracts (or on temporary contracts, and not seeking permanent employment) and who earn more than 2/3 of the UK median wage.
17. Gender pay difference.
18. Percentage of people living in households in income poverty relative to the UK median: measured for children, working age and those of pension age.
19. Percentage of people living in households in material deprivation.
20. Percentage of people moderately or very satisfied with their jobs.
21. Percentage of people in employment.
22. Percentage of people in education, employment or training, measured for different age groups.
23. Percentage who feel able to influence decisions affecting their local area.
24. Percentage of people satisfied with their ability to get to/ access the facilities and services they need.
25. Percentage of people feeling safe at home, walking in the local area, and when travelling.
26. Percentage of people satisfied with local area as a place to live.
27. Percentage of people agreeing that they belong to the area; that people from different backgrounds get on well together; and that people treat each other with respect.
28. Percentage of people who volunteer.
29. Mean mental well-being score for people.
30. Percentage of people who are lonely.
31. Percentage of dwellings which are free from hazards.
32. Number of properties (homes and businesses) at medium or high risk of flooding from rivers and the sea.
33. Percentage of dwellings with adequate energy performance.
34. Number of households successfully prevented from becoming homeless per 10,000 households.
35. Percentage of people attending or participating in arts, culture or heritage activities at least three times a year.
36. Percentage of people who speak Welsh daily and can speak more than just a few words of Welsh.
37. Percentage of people who can speak Welsh.
38. Percentage of people participating in sporting activities three or more times a week.
39. Percentage of museums and archives holding archival/heritage collections meeting UK accreditation standards.
40. Percentage of designated historic environment assets that are in stable or improved conditions.
41. Emissions of greenhouse gases within Wales.
42. Emissions of greenhouse gases attributed to the consumption of global goods and services in Wales.
43. Areas of healthy ecosystems in Wales.
44. Status of Biological diversity in Wales.
45. Percentage of surface water bodies, and groundwater bodies, achieving good or high overall status.
46. The social return on investment of Welsh partnerships within Wales and outside of the UK that are working towards the United Nations Sustainable Development Goals.
SOURCE:https://www.gov.wales/sites/default/files/publications/2019-06/national…
Scotland Humankind Index
(OXFAM Scotland 2012)
Affordable/decent home/a safe and secure place to live in
Being physically and mentally healthy
Living in a neighbourhood where you can enjoy going outside and having a clean and healthy environment
Having satisfying work to do (paid or unpaid)
Having good relationships with family and friends
Feeling that you and those you care about are safe
Access to green spaces/access to wild spaces/social/play areas
Work/secure work/suitable work
Having enough money to pay the bills and buy what you need
Having a secure source of money
Access to arts/culture/interest/stimulation/learning/hobbies/leisure activities
Having the facilities you need locally
Getting enough skills and education to live a good life
Being part of a community
Having good transport to get where you need to go
Being able to access high-quality services
Human rights/freedom from discrimination/acceptance/respect
Feeling good
SOURCE:https://oxfamilibrary.openrepository.com/bitstream/handle/10546/293743/…
Bhutan Gross National Happiness
In 1972, the 4th King declared Gross National Happiness to be more important than GNP, and from this time onward, the country oriented its national policy and development plans towards Gross National Happiness (or GNH). The Constitution of Bhutan (2008, Article 9) directs the State “to promote those conditions that will enable the pursuit of Gross National Happiness.”
Today, GNH is technically defined as a “multidimensional development approach seeking to achieve a harmonious balance between material well-being and the spiritual, emotional and cultural needs of society.” The keywords being harmonious balance – that may be achieved by balancing the needs of the body with those of the mind.
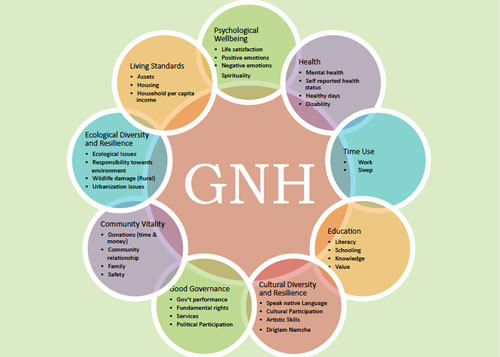
Figure 1: The nine domains and 33 indicators of the GNH index
DOMAINS OF BHUTAN'S GROSS NATIONAL HAPPINESS
i. Psychological Wellbeing
Life satisfaction
Emotional balance (positive and negative emotions)
Spirituality
ii. Health
Self-reported health status
Healthy days
Long-term disability
Mental health
iii. Education
Literacy
Educational qualification
Knowledge
Values
iv. Culture
Language
Artisan skills
Socio-cultural participation
Driglam Namzha (Way of Harmony: formal etiquette)
v. Time Use
Working hours
Sleeping hours
vi. Good Governance
Political participation
Political freedom
Service delivery
Government performance
vii. Community Vitality
Social support
Community relationships
Family
Victim of crime
viii. Ecological Diversity and Resilience
Pollution
Environmental responsibility
Wildlife
Urban issues
ix. Living Standards
Household income
Assets
Housing quality
In the GNH Index, unlike certain concepts of happiness in current western literature, happiness is itself multidimensional – not measured only by subjective well-being, and not focused narrowly on happiness that begins and ends with oneself and is concerned for and with oneself. The pursuit of happiness is collective, though it can be experienced deeply personally. Different people can be happy in spite of their disparate circumstances and the options for diversity must be wide.
Prime Minister of Bhutan: “We have now clearly distinguished the ‘happiness’ … in GNH from the fleeting, pleasurable ‘feel good’ moods so often associated with that term. We know that true abiding happiness cannot exist while others suffer, and comes only from serving others, living in harmony with nature, and realizing our innate wisdom and the true and brilliant nature of our own minds.”
SOURCE:Ura, Karma, Sabina Alkire, Tshoki Zangmo and Karma Wangdi. 2012. A Short Guide to Gross National Happiness Index. Thimphu, Bhutan: Centre for Bhutan Studies. 96 p. Retrieved from Bhutan Gross National Happiness Commission October 2012. http://www.gnhc.gov.bt/
SOURCE: https://www.gnhcentrebhutan.org/gnh-happiness-index/

Last updated 9 January 2023